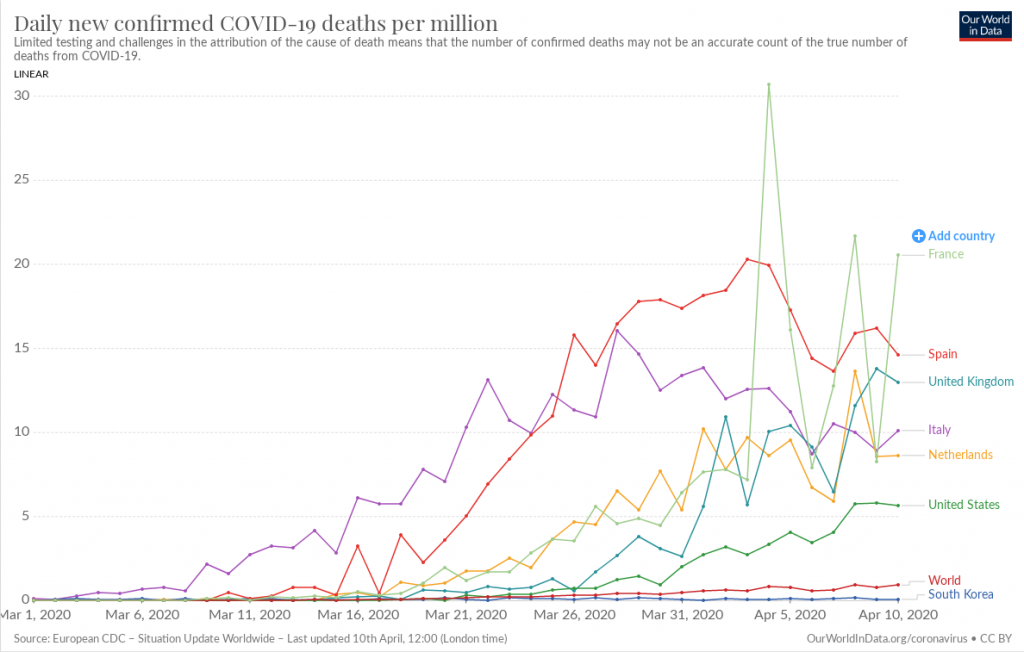
Two days ago, a prominent Greek newspaper ran a news story titled “Almost 2000 coronavirus deaths in the U.S.—the world’s worst daily number”.
I’m appalled at the usage of a number in such a meaningless way—particularly the fact that the U.S. of 330m people is being compared to, e.g., 50m Spain. You can equally well say “Greece has only 60k trucks when the U.S. has 2m—and the government’s doing nothing about it”. Unfortunately, numbers out of context is the commonest thing when it comes to the pandemic. Only a few crazy guys insist upon looking at the ratio of deaths per population—Willis Eschenbach and I are two examples.

I added more context to this chart in my previous post. But there is still an important detail missing.
Suppose you have cancer, and the doctor tells you you have about three months to live. Two months later you contract the coronavirus, and one month later you die of pneumonia. What is the cause of death?
This is where I disagree with the disclaimer of the chart above. It says “Limited testing and challenges in the attribution of the cause of death means that the number of confirmed deaths may not be an accurate count of the true number of deaths from COVID-19.” But since causal relationships in death (as in life) are sometimes unclear or nonexistent, I hold that there is no such thing as a “true number of deaths from COVID-19”.
In the United States, about 12 thousand people normally die every day. These days there are 2 thousand coronavirus-related deaths every day. But what happens to the total? Has it jumped to 14 thousand? Has it stayed at 12 thousand? Maybe 12.5 thousand? Maybe it went over 14 thousand because of deaths of people with an unrelated disease who couldn’t find a bed in the ICU?
Luckily, the information I’m looking for exists, at least for Europe:

The expected range of daily deaths is near the red line, whereas the actual number of daily deaths is the continuous black line. Several things are striking, however it is too early to make any interpretation, since the data for this chart is accurate only up to about 15 March.
Back to trucking, logistics, and IT, I will repeat yesterday’s question. Trucking companies have engaged in a price race to the bottom, so their profits are nearing zero. For this reason, they are reluctant to invest in IT—or so I’ve been told. But if a company can (and does) spend hundreds of thousands to buy a single truck, why wouldn’t they also spend a few hundred thousand on automation, in order to manage their fleet better? (I expanded on this question on my previous post).
Is it, like with the coronavirus, because they aren’t looking at the correct context? Or is it I who’s missing some context? Or both?